Soil Texture Triangle
“Feel the soil running through your fingers; now, how can you classify it?”
Soil Science Division Staff. Soil Survey Manual. United States Department of Agriculture Handbooks. United States Department of Agriculture, 2017.
The United States Department of Agriculture soil classification triangle is a measurement diagram used to classify soil types based only by texture. As defined by the USDA in 1927, “Texture is that quality of soil material resulting from its proportionate composition of sand, silt, and clay.”1 The three soil textural classes of sand, silt, and clay, are subdivisions of grain size, and form the three axes of the triangular diagram.2 Soil type is determined by measuring or estimating the percentage of each textural class within a given sample. For instance, a sample of sixty-percent sand and thirty-percent clay is considered “sandy clay loam”.
In the late nineteenth century, the agronomist Milton Whitney theorized that crop adaptability and production were most affected by soil moisture content instead of chemical composition. Since moisture content is largely determined by soil texture, Whitney’s theory led to the development of the texture triangle. Published in 1911, the texture triangle3 became an international benchmark for establishing soil textural classes based on quantity.4 The diagram only contained two of the three components of the contemporary diagram: clay and silt.
In 1927, a third axis, containing the proportion of sand, was added to make the diagram more practical, as sand was easiest to estimate while conducting fieldwork - before sending a sample to a lab, its class could be more accurately-estimated on site.5 The USDA describes the texture of the particles as follows: ‘Sand particles feel gritty and can be seen individually with the naked eye. Silt particles have a smooth feel to the fingers when dry or wet and cannot be seen individually without
magnification. Clay soils are sticky in some areas and not sticky in others.’6 After making several changes to the ranges of the classes and adding ‘silt’ and ‘loamy sand,’ the current classification triangle was published in 1951.
More recent research shows that soil texture is an important denominator in numerous soil properties that correlate to regional plant variation such as drainage, water holding capacity, aeration![]() , susceptibility to erosion, and organic matter content.7
, susceptibility to erosion, and organic matter content.7
![]() Image source:
Soil Science Division Staff. Soil Survey Manual. United States Department of Agriculture Handbooks. United States Department of Agriculture, 2017.
Image source:
Soil Science Division Staff. Soil Survey Manual. United States Department of Agriculture Handbooks. United States Department of Agriculture, 2017.
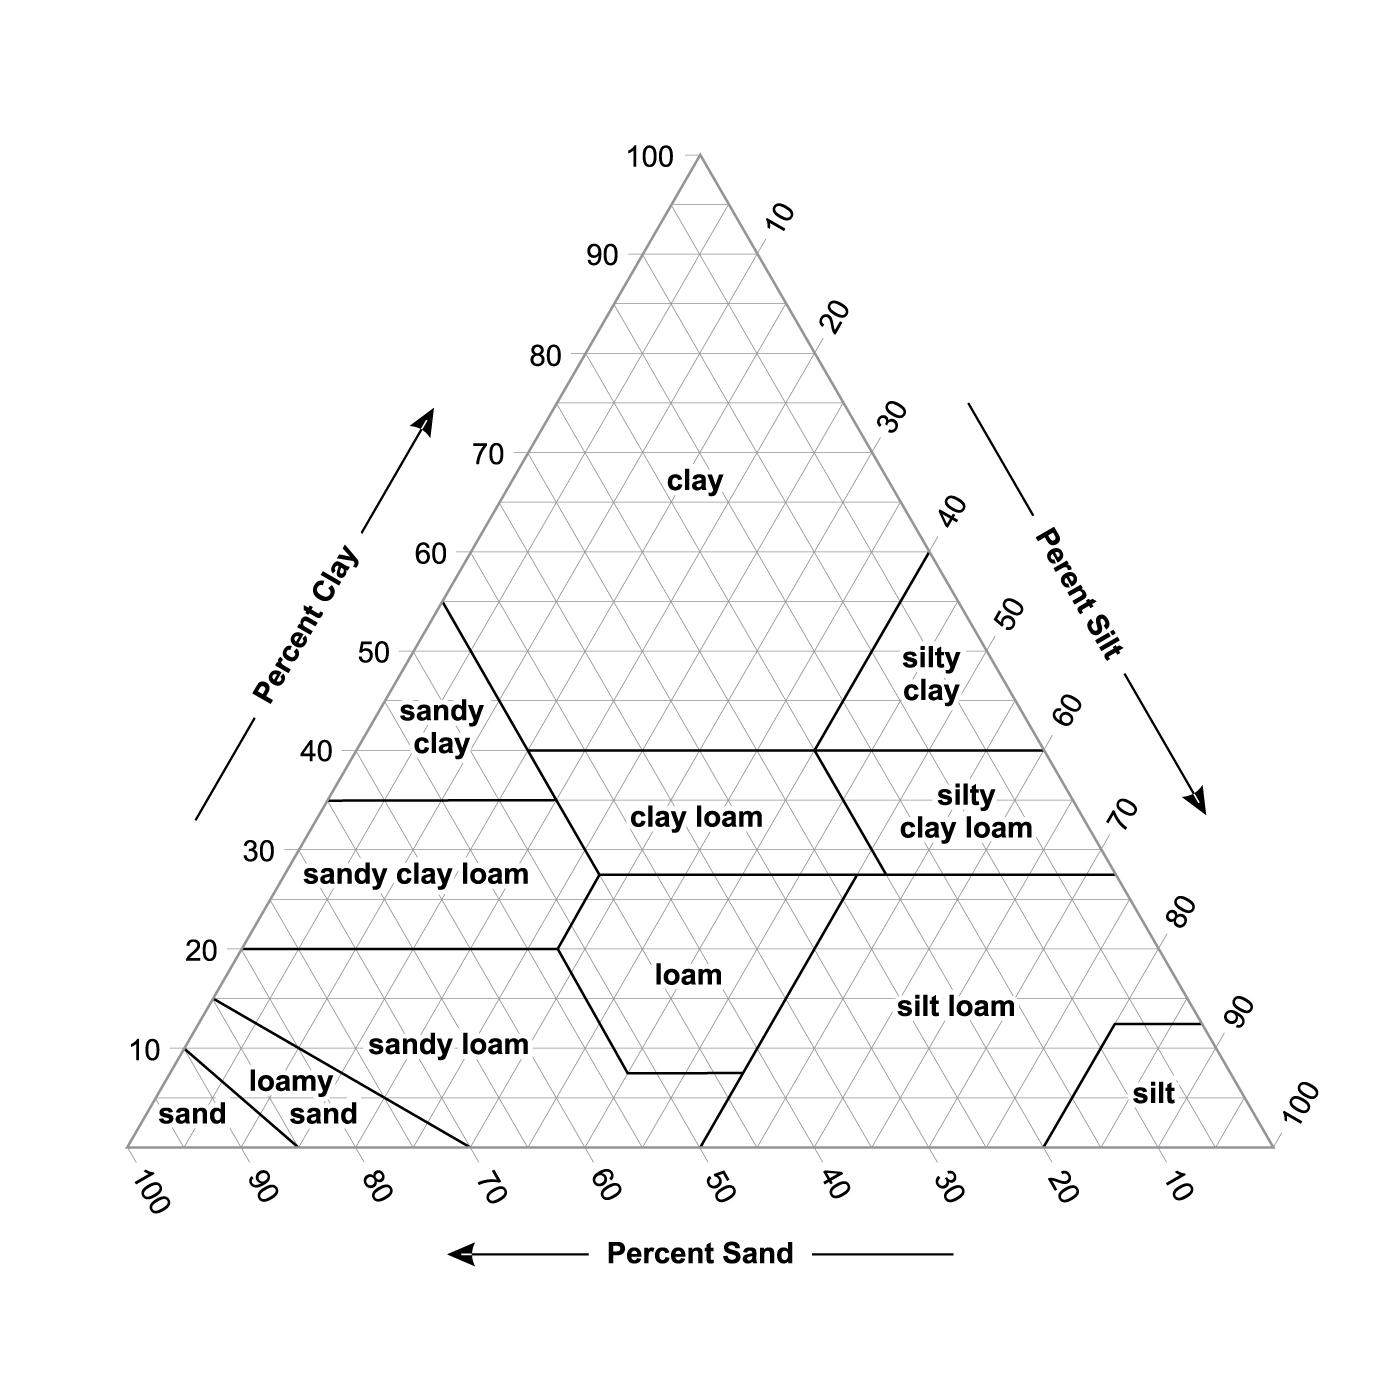 Image source:
Soil Science Division Staff. Soil Survey Manual. United States Department of Agriculture Handbooks. United States Department of Agriculture, 2017.
Image source:
Soil Science Division Staff. Soil Survey Manual. United States Department of Agriculture Handbooks. United States Department of Agriculture, 2017.
References
1. Davis, R. O. E., and H. H. Bennett. Grouping of Soils on the Basis of Mechanical Analysis. Washington, US: United States Department of Agriculture, 1927.
2. Berry, Wayne, Quirine Ketterings, Steve Antes, Steve Page, Jonathan Russell-Anelli, Renuka Rao, and Steve DeGloria. ‘Agronomy Fact Sheet Series: Soil Texture’. Cornell University Cooperative Extension, 2007.
3. Gardner, David Rice. ‘The National Cooperative Soil Survey of the United States’. Harvard University, 1998.
4. Soil Science Division Staff. Soil Survey Manual. United States Department of Agriculture Handbooks. United States Department of Agriculture, 2017.
5. Jelinski, Nic. ‘The Historical Development of the USDA Textural Triangle’. Blog. University of Minnesota Soil Judging Team, 2014. http://umnsoilsteam.blogspot.com/2014/09/the-historical-development-of-usda.html.
6. Soil Science Division Staff. Soil Survey Manual. United States Department of Agriculture Handbooks. United States Department of Agriculture, 2017.
7. Berry, Wayne, Quirine Ketterings, Steve Antes, Steve Page, Jonathan Russell-Anelli, Renuka Rao, and Steve DeGloria. ‘Agronomy Fact Sheet Series: Soil Texture’. Cornell University Cooperative Extension, 2007.